Node.js is
single-threaded. This is one of its most important architectural
characteristics — and when you do not understand it, it is one of the easiest
ways to inadvertently create massive performance problems. A Node.js server
that handles hundreds of requests per second beautifully can suddenly become
sluggish when one piece of synchronous code blocks the event loop for just 50
milliseconds.
This guide covers the most
common Node.js performance problems, how to diagnose them using profiling
tools, and specific code-level fixes for each one.
Understanding the Node.js Event Loop (The Key to Everything)
Node.js processes all
JavaScript in a single thread using the event loop. This means: while one
operation is running, nothing else can run in that thread. For I/O operations
(reading files, querying databases, making HTTP requests), Node.js delegates
the work to the OS and registers a callback — freeing the event loop to handle
other requests while waiting. This is why Node.js handles concurrency well
despite being single-threaded. But if you run CPU-intensive synchronous code
(complex calculations, synchronous file reads, large JSON parsing), it blocks
the event loop — no other requests can be processed until it finishes. This is
the single most common cause of Node.js performance problems.
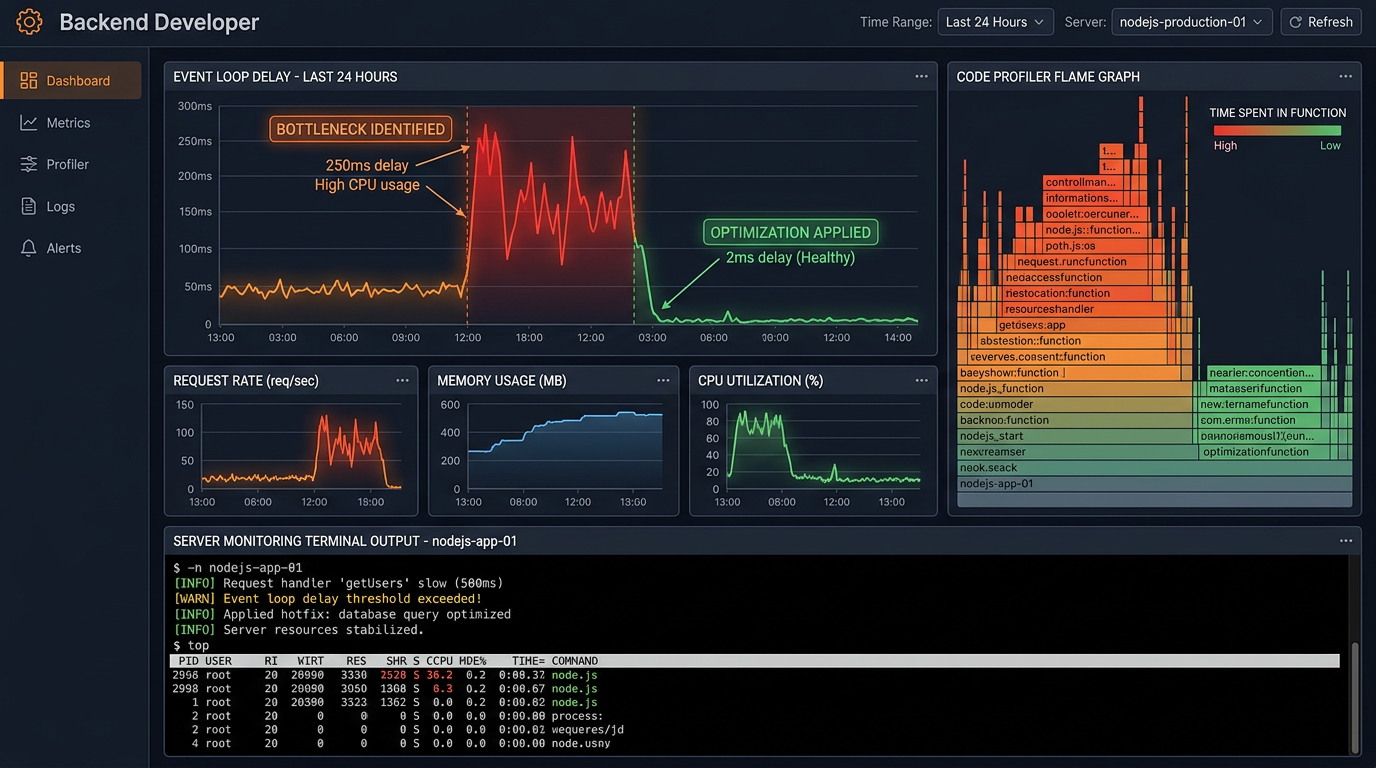
Step 1: Measure Before You Optimize
Use Clinic.js for Quick Diagnosis
Clinic.js is a free
Node.js performance profiling toolkit. Run npm install -g clinic, then clinic
doctor -- node your-app.js. Run a load test against your application, stop it,
and Clinic.js generates an HTML report that immediately tells you whether your
bottleneck is event loop blocking, CPU usage, memory, or I/O. It is the fastest
way to identify what type of problem you have before diving deeper.
Node.js Built-in Profiler
Run your app with the
flag: node --prof app.js. Perform the slow operation, then stop the server.
This creates a profiling log file. Process it with: node --prof-process
isolate-*.log > profile.txt. Look for the top functions consuming CPU time
in the output — these are your hotspots.
Fix 1: Stop Blocking the Event Loop
The most impactful fix for
most slow Node.js apps. Audit your code for: synchronous file system operations
(fs.readFileSync, fs.writeFileSync), JSON.parse() on large objects, synchronous
loops with heavy computation, and complex regular expressions. Replace
synchronous FS calls with their async equivalents: fs.readFile() or the
promise-based fs.promises.readFile(). For CPU-heavy computations, move the work
to a Worker Thread (the worker_threads module), which runs on a separate thread
and does not block the event loop.
Fix 2: Fix Memory Leaks
How to Detect a Memory Leak
A memory leak causes your
Node.js process to consume more and more RAM over time until the server crashes
or becomes unusably slow. Monitor your process memory with:
process.memoryUsage(). If heapUsed keeps growing without stabilizing, you
likely have a leak. Use node --inspect to connect Chrome DevTools to your
Node.js process and take heap snapshots over time to see what objects are
accumulating.
Common Memory Leak Causes
Global variables that
accumulate data: arrays or objects stored globally that are added to but never
cleared. Event listener accumulation: adding listeners (EventEmitter.on())
inside loops or request handlers without removing them with .off() or .removeListener().
Closure references holding onto large objects. Cache without limits: an
in-memory cache that grows indefinitely. Fix by implementing cache eviction
policies (LRU caches) using libraries like lru-cache.
Fix 3: Optimize Database Queries
Database queries are often
the biggest bottleneck in Node.js applications. Common issues: N+1 query
problem (making one query to get a list, then one additional query per item in
the list — replace with a join query or use eager loading in your ORM). Missing
database indexes on frequently queried columns. Fetching more data than needed
— use SELECT with specific columns instead of SELECT *. Loading entire result
sets when you only need a page — implement pagination. Use query analysis
(EXPLAIN in MySQL/PostgreSQL) to understand how queries execute.
Fix 4: Implement Caching
If the same data is
fetched repeatedly and does not change frequently, cache it. Redis is the
standard in-memory caching solution for Node.js applications. Cache database
query results, API responses to external services, and computed values.
Implement cache invalidation when underlying data changes. Even a simple
in-memory cache using a Map for very frequently accessed, rarely-changing data
can dramatically reduce database load.
Fix 5: Use Clustering to Utilize Multiple CPU Cores
A single Node.js process
uses only one CPU core. On a server with 4 or 8 cores, you are wasting 75–87%
of your CPU capacity by default. Node.js's built-in cluster module or the PM2
process manager can spawn multiple worker processes — one per CPU core — each
handling a share of incoming requests. PM2 makes this trivial: pm2 start app.js
-i max automatically spawns as many processes as there are CPU cores. This can
multiply your throughput proportionally to the number of cores.
Fix 6: Optimize HTTP Response Handling
Enable GZIP or Brotli
compression for HTTP responses using the compression middleware for Express.
Use HTTP/2 which allows multiplexing multiple requests over a single
connection. Stream large responses instead of buffering them in memory — this
is critical when sending large files or large datasets. Implement connection
keep-alive so browsers reuse TCP connections rather than opening new ones for
every request.
Fix 7: Optimize npm Dependencies
Audit your package.json
for unused dependencies and remove them. Use require() only where needed —
loading large modules at the top of every file that uses them incurs startup
overhead. Consider importing only the specific functions you need from utility
libraries instead of importing the entire library.